OTOBO BI and Reporting: Statistics and Evaluations with Power BI and Excel
OTOBO BI and Reporting: Statistics and Evaluations with Power BI and Excel
Section titled “OTOBO BI and Reporting: Statistics and Evaluations with Power BI and Excel”In the OTOBO Helpdesk, you can create extensive statistics and reports to gain valuable insights into your support processes. With OTOBO BI (Business Intelligence) and tools like Power BI or Excel, you can analyze your data in depth and meet your reporting requirements. The data can be easily exported as CSV and used for further evaluations in Power BI to gain valuable insights for management and the optimization of your helpdesk.

Setting up Statistics Permissions in OTOBO
Section titled “Setting up Statistics Permissions in OTOBO”To be able to create statistics in OTOBO, you need the stats permissions. These can be adjusted in the Admin area under the Agent tile. By specifically assigning these permissions, administrators can ensure that only authorized users can access and edit sensitive data.
See the section “Difference between ro and rw statistics permissions” below for more details.
Statistics Management in the OTOBO Portal
Section titled “Statistics Management in the OTOBO Portal”In the Statistics Management menu item of the OTOBO portal, you get an overview of all statistics already created. Here you can view and analyze existing statistics as well as create new statistics according to your needs.

Functions of Statistics Management
Section titled “Functions of Statistics Management”- Overview of all statistics: Central management of statistics with easy navigation to the desired data.
- Create new statistics: Via “Add Statistics” you can create and customize new statistics.
- View existing statistics: Click on a statistics number to view detailed information and analyses.
- Import statistics: Import statistics from other OTOBO instances via the import function.
Creating a New Statistic in OTOBO
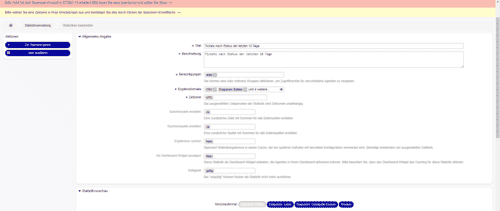
Section titled “Creating a New Statistic in OTOBO”In the Statistics Management menu item, you can create a new statistic. Creating a statistic includes selecting the statistics type as well as the detailed configuration of the required parameters in the form.

Statistics Types
Section titled “Statistics Types”- Dynamic Matrix: Representation of data in a cell-based format.
- Dynamic List: List-based representation with various attributes.
- Static: Fixed, non-configurable statistics for predefined data analyses.
Evaluating Statistics and Using CSV Files
Section titled “Evaluating Statistics and Using CSV Files”After you have created a statistic, it is displayed in the statistics list. You can execute the statistic and export it in the desired format.

The exported data can be downloaded as a CSV file, which offers you a multitude of possibilities for further analysis.
OTOBO Statistics with Business Intelligence – Power BI and Excel
Section titled “OTOBO Statistics with Business Intelligence – Power BI and Excel”Data Export from OTOBO
Section titled “Data Export from OTOBO”After you have created a statistic in OTOBO and exported it as a CSV file, you can import the data into Business Intelligence tools like Microsoft Power BI or Excel. This enables in-depth analyses, visualizations, and reporting.
Importing OTOBO Statistics Data into Excel
Section titled “Importing OTOBO Statistics Data into Excel”- Open CSV file: Open Excel and select “Data” > “From Text/CSV”. Select the downloaded OTOBO CSV file.
- Analyze data: Use Excel functions like Pivot tables, charts, and filters to analyze the data and create reports.
- Automate reports: Use macros or Excel formulas to generate automatic evaluations of your statistics data.
Importing OTOBO Statistics Data into Power BI
Section titled “Importing OTOBO Statistics Data into Power BI”- Open Power BI: Start Power BI Desktop and select “Get Data” > “Text/CSV”. Select the exported CSV file.
- Prepare data: Use Power BI to clean and transform the data, e.g., by removing unnecessary columns or renaming attributes.
- Create visualization: Create interactive dashboards and reports by using the various visualization tools in Power BI. For example, you can create charts for ticket distribution, average processing time, or customer satisfaction.
- Automatic update: Connect Power BI to your OTOBO instance to enable regular updates of your statistics data in real-time.
Advantages of OTOBO Business Intelligence with Power BI and Excel
Section titled “Advantages of OTOBO Business Intelligence with Power BI and Excel”- Detailed analyses: With OTOBO BI and Power BI, you identify bottlenecks and trends in the ticket workflow to optimize service processes.
- Automated reporting: Through integration into Power BI or Excel, you create regular reports and have them updated automatically.
- Interactive dashboards: Use Power BI to create interactive dashboards that offer real-time insights into the performance of your helpdesk.
Displaying OTOBO Statistics in the Dashboard
Section titled “Displaying OTOBO Statistics in the Dashboard”You can also display the statistics in the dashboard as a widget. To do this, you must open the statistics settings and activate the option “Show as dashboard widget”.
Creating an OTOBO Report – Automated Evaluation
Section titled “Creating an OTOBO Report – Automated Evaluation”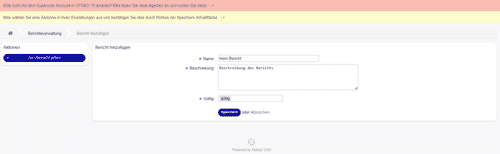
Via the statistics navigation menu, you can create a new report and add statistics to the report. This report is sent at regular intervals via email, so that you always remain informed about current developments.
Summary
Section titled “Summary”With the statistics and reporting tools in OTOBO, you can gain valuable insights into your support processes. By exporting the statistics data as CSV files and using Business Intelligence tools like Power BI and Excel, you have the possibility to analyze your data comprehensively and create meaningful reports. Use these functions to improve the efficiency and quality of your customer service.
Do you have questions about OTOBO statistics or integration into Power BI? Contact us for more information!