OTOBO BI und Reporting: Statistiken und Auswertungen mit Power BI und Excel
This content is not available in your language yet.
OTOBO BI und Reporting: Statistiken und Auswertungen mit Power BI und Excel
Abschnitt betitelt „OTOBO BI und Reporting: Statistiken und Auswertungen mit Power BI und Excel“Im OTOBO Helpdesk können Sie umfangreiche Statistiken und Berichte erstellen, um wertvolle Einblicke in Ihre Supportprozesse zu erhalten. Mit OTOBO BI (Business Intelligence) und Tools wie Power BI oder Excel können Sie Ihre Daten tiefgehend analysieren und Ihre Reporting-Anforderungen erfüllen. Die Daten können einfach als CSV exportiert und für weitergehende **Auswertungen ** in Power BI genutzt werden, um so wertvolle Erkenntnisse für das Management und die Optimierung Ihres Helpdesks zu gewinnen.

Einrichten von Statistik-Berechtigungen in OTOBO
Abschnitt betitelt „Einrichten von Statistik-Berechtigungen in OTOBO“Um Statistiken in OTOBO erstellen zu können, benötigen Sie die stats Berechtigungen. Diese können im Admin-Bereich unter der Agenten-Kachel angepasst werden. Durch die gezielte Vergabe dieser Berechtigungen können Administratoren sicherstellen, dass nur autorisierte Benutzer auf sensible Daten zugreifen und diese bearbeiten können.
Siehe Abschnitt “Unterschied zwischen ro und rw Statistik-Berechtigungen” weiter unten für mehr Details.
Statistikverwaltung im OTOBO Portal
Abschnitt betitelt „Statistikverwaltung im OTOBO Portal“Im Menüpunkt Statistikverwaltung des OTOBO Portals erhalten Sie eine Übersicht aller bereits erstellten Statistiken. Hier können Sie sowohl bestehende Statistiken einsehen und analysieren, als auch neue Statistiken nach Ihren Bedürfnissen erstellen.

Funktionen der Statistikverwaltung
Abschnitt betitelt „Funktionen der Statistikverwaltung“- Übersicht aller Statistiken: Zentrale Verwaltung der Statistiken mit einfacher Navigation zu den gewünschten Daten.
- Neue Statistiken erstellen: Über “Add Statistics” können Sie neue Statistiken erstellen und anpassen.
- Bestehende Statistiken anzeigen: Klicken Sie auf eine Statistiknummer, um detaillierte Informationen und Analysen anzuzeigen.
- Statistiken importieren: Importieren von Statistiken aus anderen OTOBO-Instanzen über die Importfunktion.
Eine neue Statistik in OTOBO erstellen
Abschnitt betitelt „Eine neue Statistik in OTOBO erstellen“Im Menüpunkt Statistikverwaltung können Sie eine neue Statistik erstellen. Die Statistikerstellung umfasst die Wahl des Statistiktyps sowie die detaillierte Konfiguration der erforderlichen Parameter im Formular.

Statistiktypen
Abschnitt betitelt „Statistiktypen“- Dynamische Matrix: Darstellung von Daten in einem zellbasierten Format.
- Dynamische Liste: Listenbasierte Darstellung mit verschiedenen Attributen.
- Statisch: Festgelegte, nicht konfigurierbare Statistiken für vordefinierte Datenanalysen.
Statistik Auswerten und CSV-Dateien nutzen
Abschnitt betitelt „Statistik Auswerten und CSV-Dateien nutzen“Nachdem Sie eine Statistik erstellt haben, wird diese in der Statistikliste angezeigt. Sie können die Statistik ausführen und im gewünschten Format exportieren.

Die exportierten Daten können als CSV-Datei heruntergeladen werden, was Ihnen eine Vielzahl an Möglichkeiten zur weiteren Analyse bietet.
OTOBO Statistiken mit Business Intelligence – Power BI und Excel
Abschnitt betitelt „OTOBO Statistiken mit Business Intelligence – Power BI und Excel“Datenexport aus OTOBO
Abschnitt betitelt „Datenexport aus OTOBO“Nachdem Sie eine Statistik in OTOBO erstellt und als CSV-Datei exportiert haben, können Sie die Daten in Business Intelligence-Tools wie Microsoft Power BI oder Excel importieren. Dies ermöglicht tiefgehende Analysen, Visualisierungen und Reporting.
OTOBO Statistikdaten in Excel importieren
Abschnitt betitelt „OTOBO Statistikdaten in Excel importieren“- CSV-Datei öffnen: Öffnen Sie Excel und wählen Sie “Daten” > “Aus Text/CSV”. Wählen Sie die heruntergeladene OTOBO-CSV-Datei aus.
- Daten analysieren: Nutzen Sie Excel-Funktionen wie Pivot-Tabellen, Diagramme und Filter, um die Daten zu analysieren und Berichte zu erstellen.
- Berichte automatisieren: Verwenden Sie Makros oder Excel-Formeln, um automatische Auswertungen Ihrer Statistikdaten zu generieren.
OTOBO Statistikdaten in Power BI importieren
Abschnitt betitelt „OTOBO Statistikdaten in Power BI importieren“- Power BI öffnen: Starten Sie Power BI Desktop und wählen Sie “Daten abrufen” > “Text/CSV”. Wählen Sie die exportierte CSV-Datei aus.
- Daten vorbereiten: Nutzen Sie Power BI, um die Daten zu bereinigen und zu transformieren, z. B. durch Entfernen unnötiger Spalten oder Umbenennen von Attributen.
- Visualisierung erstellen: Erstellen Sie interaktive Dashboards und Berichte, indem Sie die verschiedenen Visualisierungstools in Power BI verwenden. Sie können beispielsweise Diagramme zur Ticketverteilung, zur durchschnittlichen Bearbeitungszeit oder zur Kundenzufriedenheit erstellen.
- Automatische Aktualisierung: Verbinden Sie Power BI mit Ihrer OTOBO-Instanz, um regelmäßige Aktualisierungen Ihrer Statistikdaten in Echtzeit zu ermöglichen.
Vorteile von OTOBO Business Intelligence mit Power BI und Excel
Abschnitt betitelt „Vorteile von OTOBO Business Intelligence mit Power BI und Excel“- Detaillierte Analysen: Mit OTOBO BI und Power BI identifizieren Sie Engpässe und Trends im Ticket-Workflow, um Serviceprozesse zu optimieren.
- Automatisiertes Reporting: Durch die Integration in Power BI oder Excel erstellen Sie regelmäßige Reports und lassen diese automatisch aktualisieren.
- Interaktive Dashboards: Nutzen Sie Power BI, um interaktive Dashboards zu erstellen, die Echtzeiteinblicke in die Leistung Ihres Helpdesks bieten.
OTOBO Statistik im Dashboard anzeigen
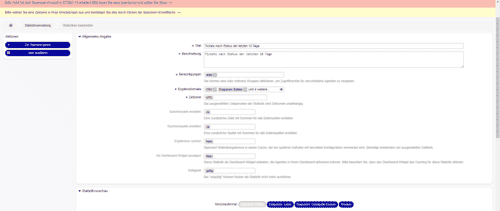
Abschnitt betitelt „OTOBO Statistik im Dashboard anzeigen“Sie können sich die Statistiken auch im Dashboard als Widget anzeigen lassen. Dazu müssen Sie die Statistik-Einstellungen öffnen und die Option “Als Dashboard-Widget anzeigen” aktivieren.
OTOBO Bericht erstellen – Automatisierte Auswertung
Abschnitt betitelt „OTOBO Bericht erstellen – Automatisierte Auswertung“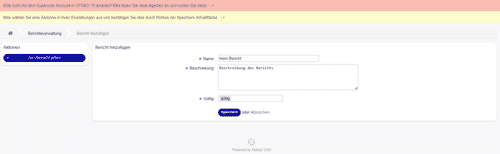
Über das Statistik-Navigationsmenü können Sie einen neuen Bericht erstellen und Statistiken zum Bericht hinzufügen. Dieser Bericht wird in regelmäßigen Zeitabständen per E-Mail versendet, sodass Sie stets über die aktuellen Entwicklungen informiert bleiben.
Zusammenfassung
Abschnitt betitelt „Zusammenfassung“Mit den Statistik- und Reporting-Tools in OTOBO können Sie wertvolle Einblicke in Ihre Supportprozesse gewinnen. Durch den Export der Statistikdaten als CSV-Dateien und die Nutzung von Business Intelligence-Tools wie Power BI und Excel haben Sie die Möglichkeit, Ihre Daten umfassend zu analysieren und aussagekräftige Reports zu erstellen. Nutzen Sie diese Funktionen, um die Effizienz und Qualität Ihres Kundenservice zu verbessern.
Haben Sie Fragen zur OTOBO Statistik oder zur Integration in Power BI? Kontaktieren Sie uns für weitere Informationen!